

This website will guide visitors to natigate the museum through a user-friendly (and mobile-adapted) website through masterpieces of the museum and wheelchaire-friendly trails.
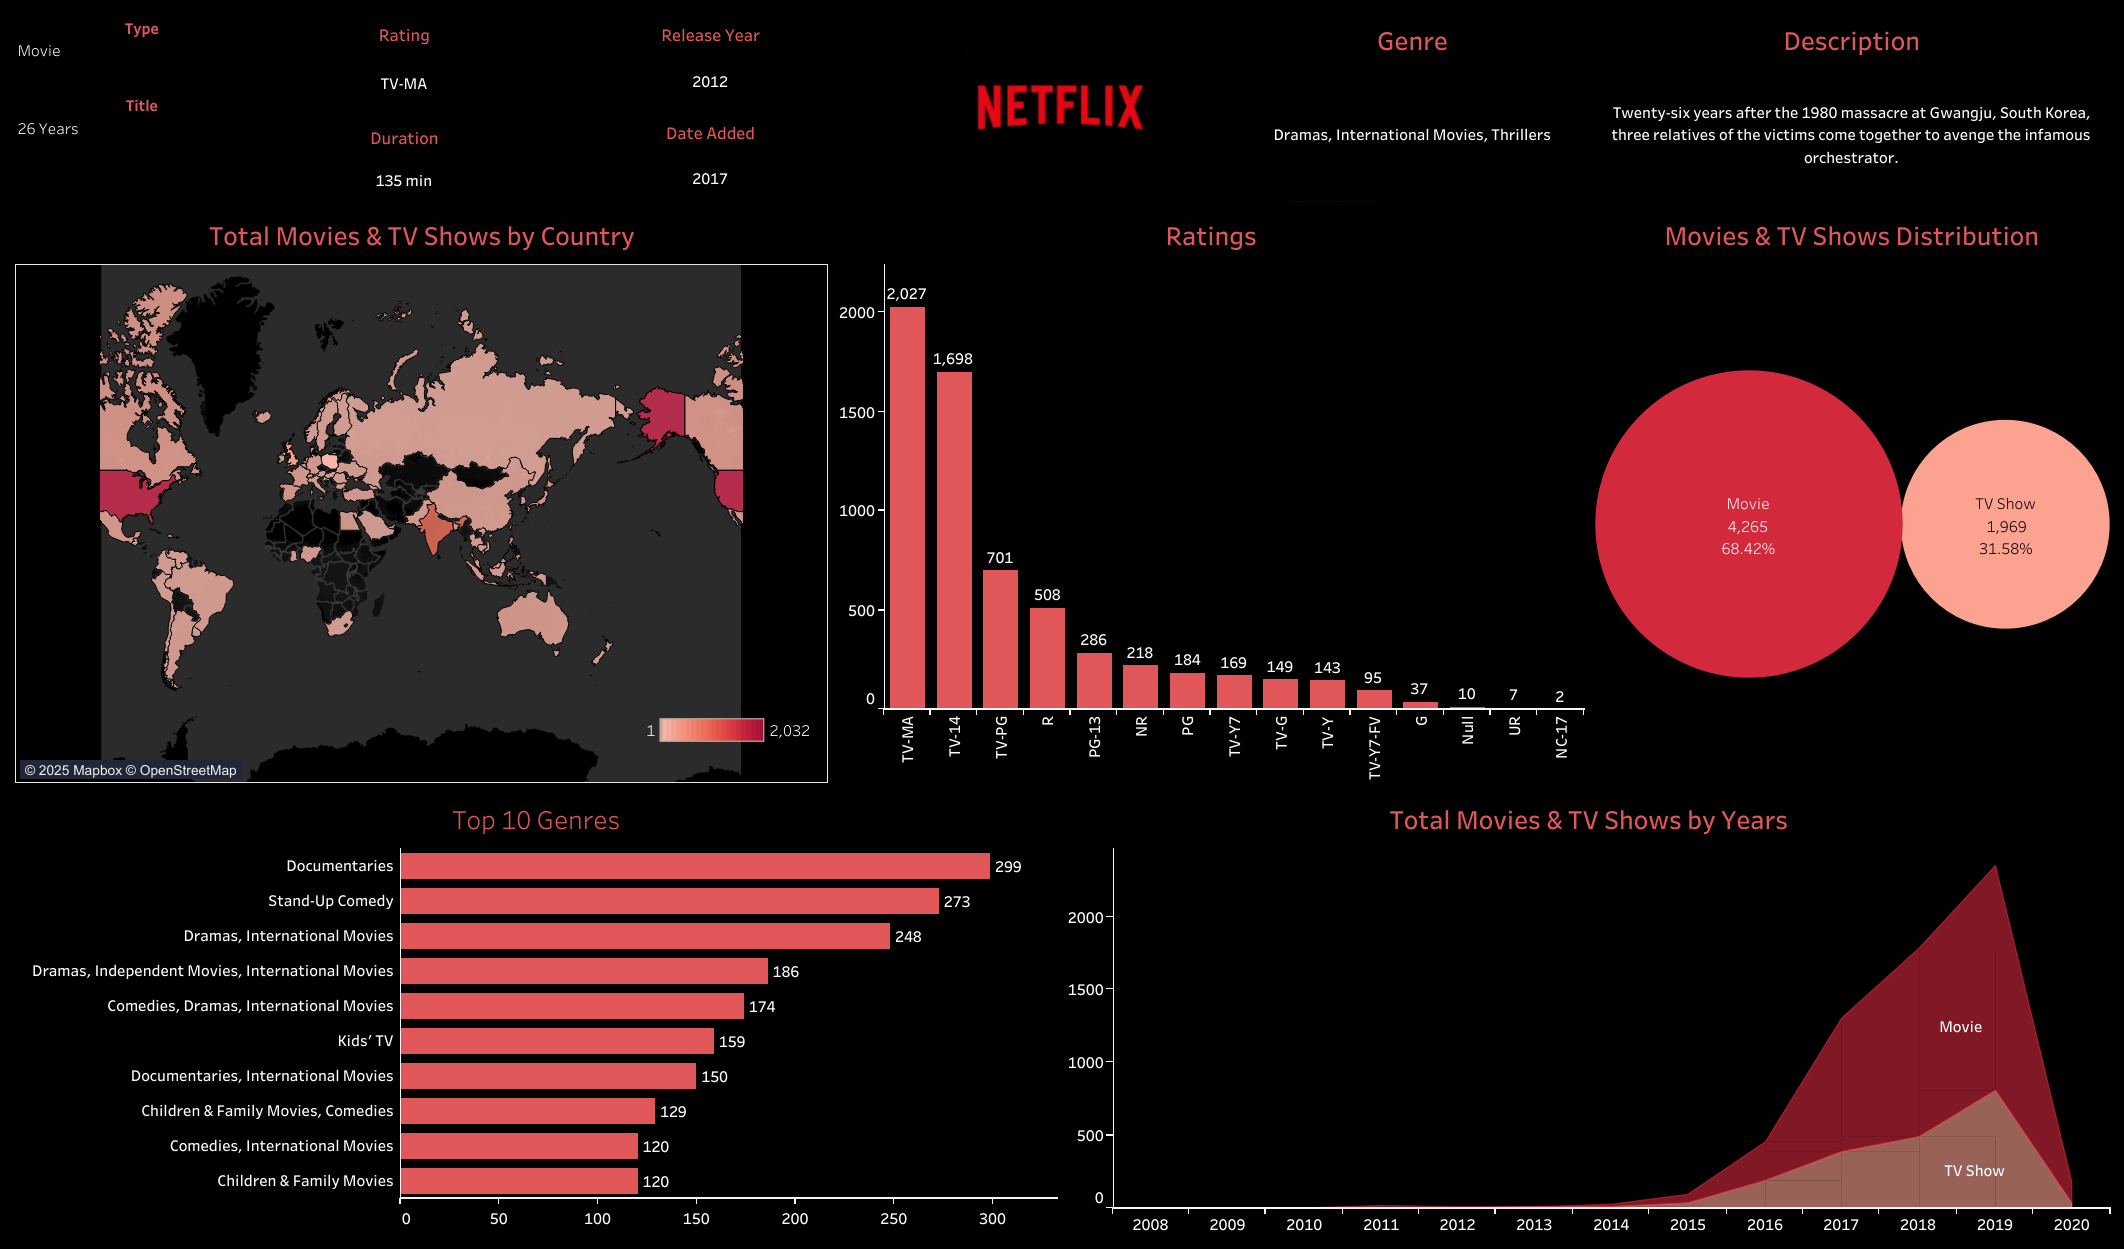
This dashboard visualizes Netflix movies and TV shows by different categories and visualizations: description, genre, country, year, and rating.

This project looks at the effect of investment in education facilities and the impact on years of schooling and wages.

The objective of this folder is to provide accessible econometric and statistical code (STATA) derived from the replication process, intended to serve as educational resources for students and researchers. The econometric analysis is based of a paper that looks into the impact of the introduction of an innovative rice variety on agricultural productivity gains.

Writing samples and research papers of different subjects (i.e gender and transportation policies, urbanization in Cape Town, etc.).
Explore my Tableau visualizations by viewing my profile dashboards.